
Productivity
Manufacturing Software That Delivers Productivity
Redzone Productivity is AI-native software for manufacturers designed to boost factory productivity, increase output, and reduce the total cost to manufacture. Embedded AI surfaces insights and identifies issues before they happen, empowering teams to solve problems before they affect production, safety, quality, or delivery.
Trusted by 2,000+ factories worldwide
to drive productivity and connect frontline teams with AI where the work happens.


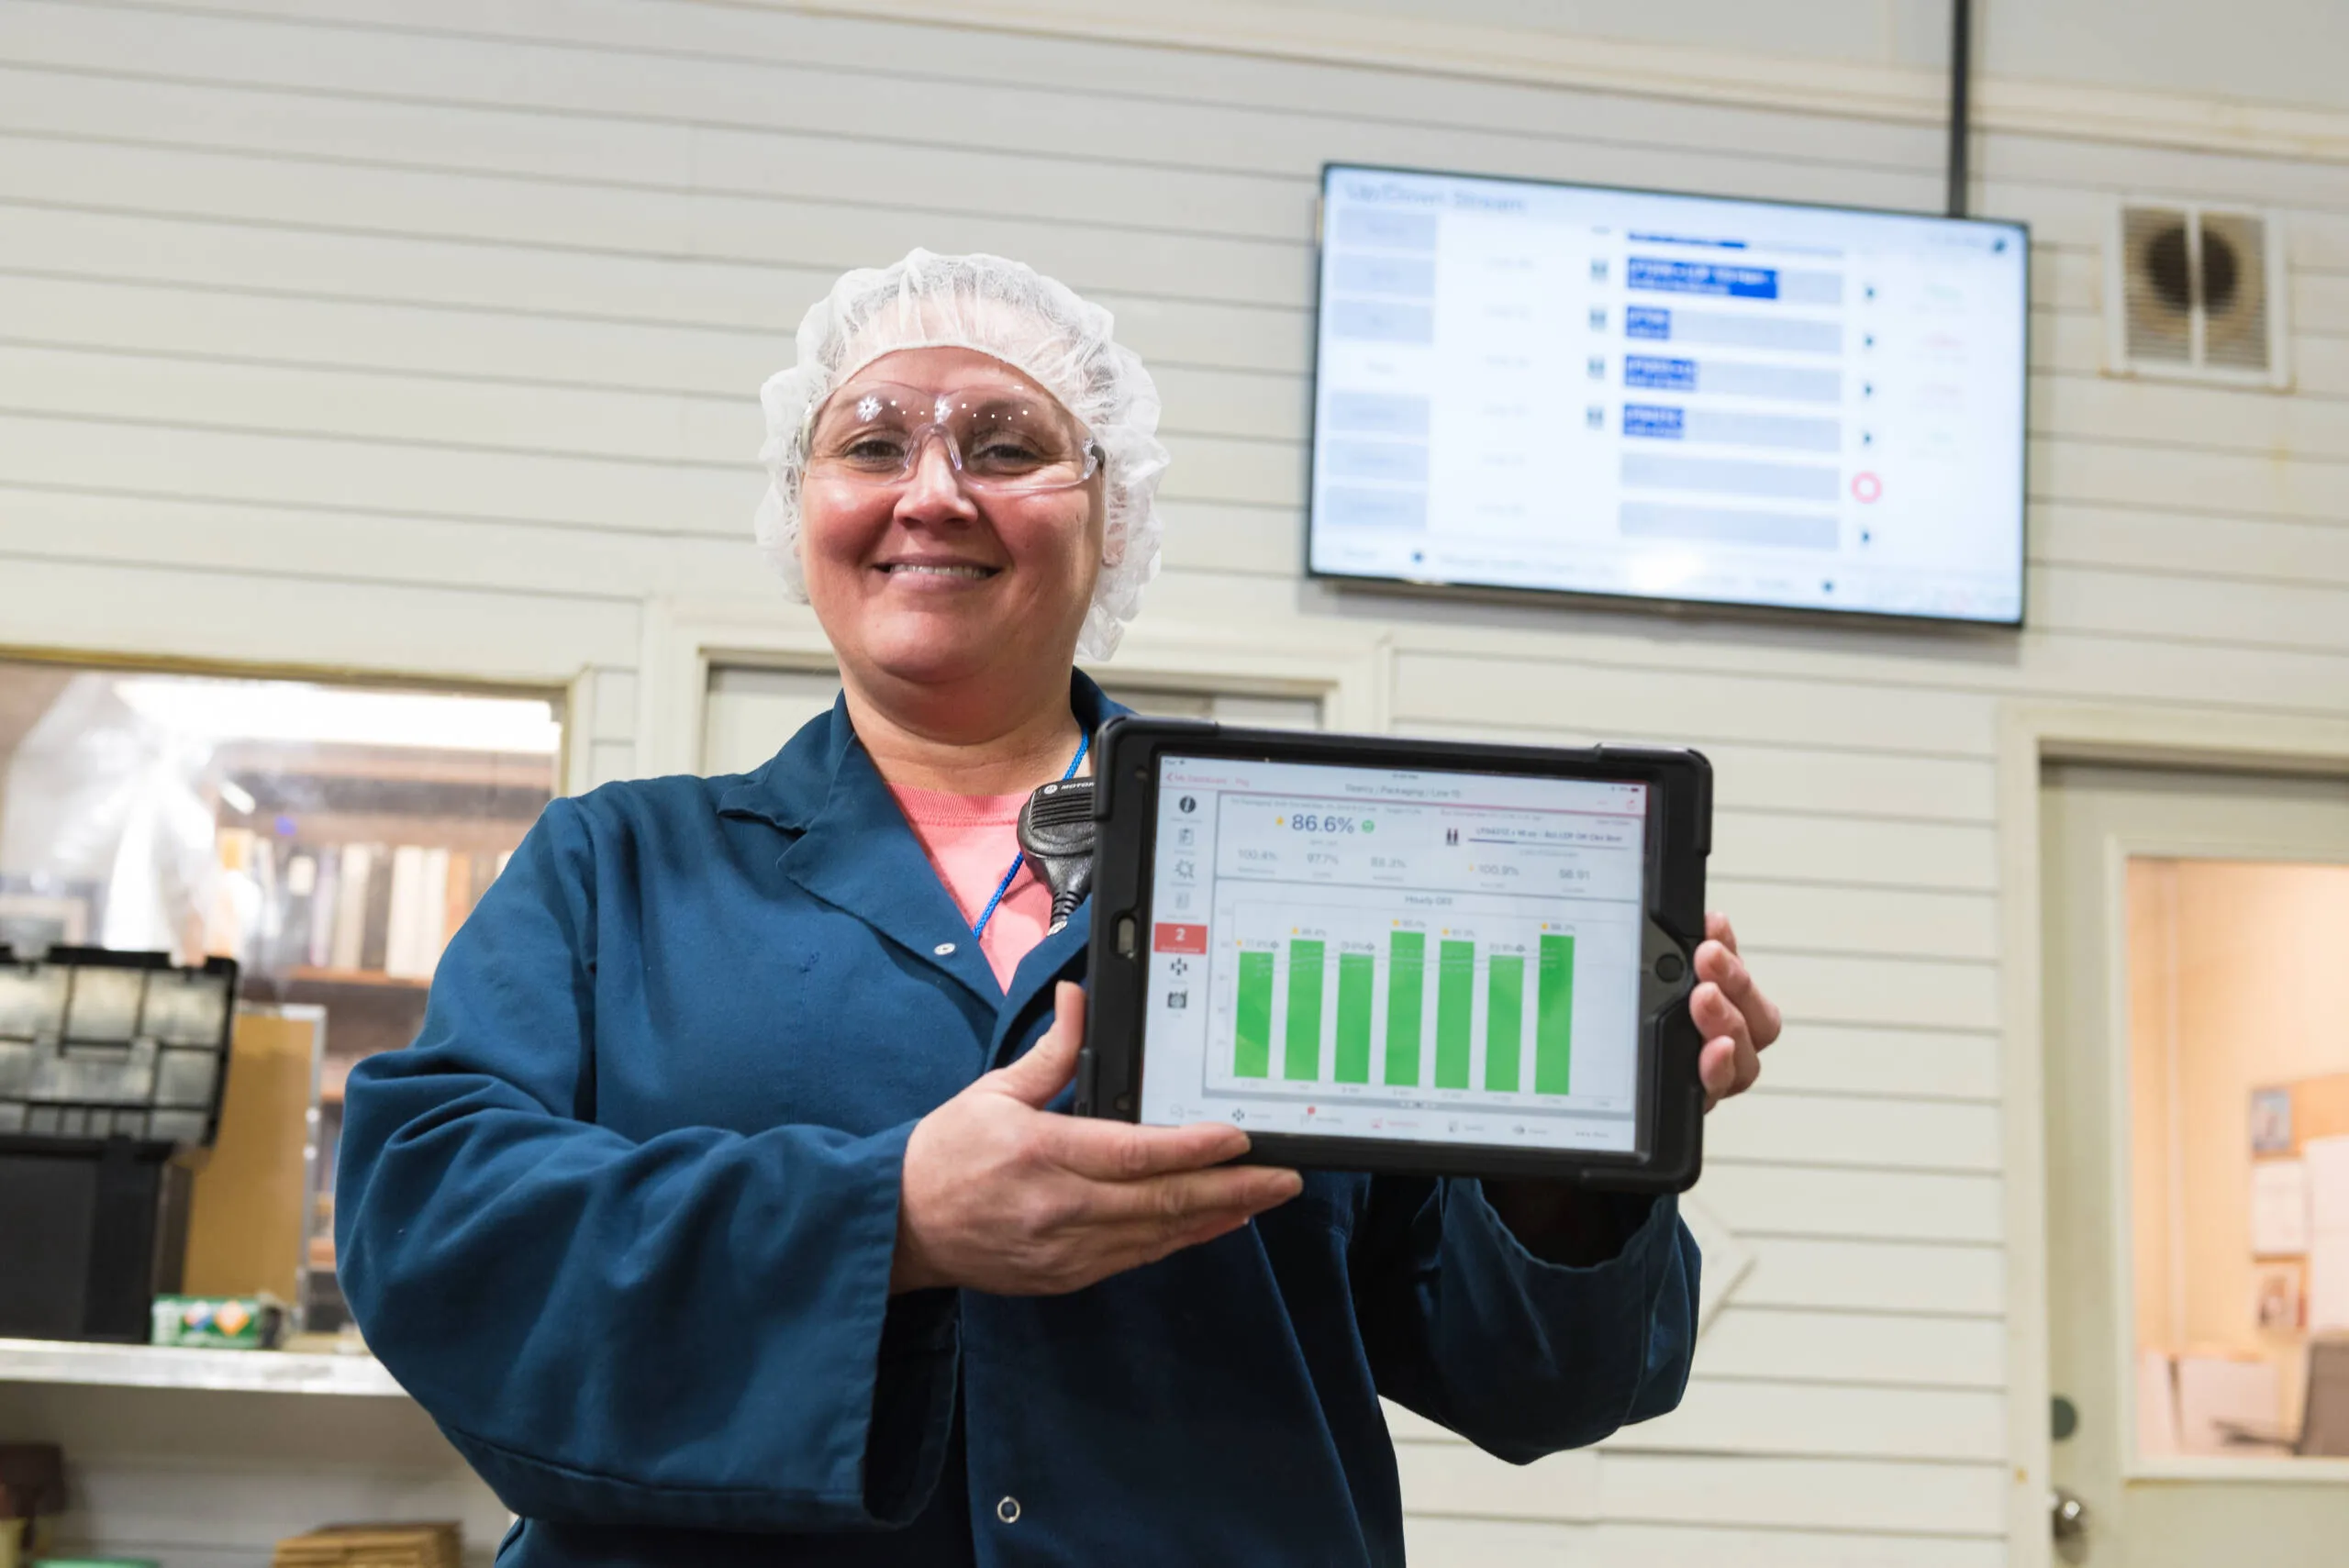
Real-Time Visibility and OEE Dashboards
Measure and track the performance of every line, shift, and product. Give frontline teams and plant leaders access to real-time data, intuitive dashboards, and customizable reports, so they know when and how to make changes.
Effective Problem Solving
Ensure teams understand top losses and collaborate on sustainable solutions with built-in lean tools and CI routines like Pareto charts, 5 Whys analysis, huddles, and fishbone diagrams.
Reporting and Analytics
Leverage robust, prebuilt reporting, a fully customizable analytics platform, and integration with external data sources to understand performance, capacity, labor utilization, and scrap levels on Day 1 of a Redzone deployment.
What Makes Redzone's Productivity Software Better
Integrated AI Guidance
Champion AI brings AI-guided insights to the frontline, where the work happens. With proactive problem identification, teams solve issues before they occur. Predictive, contextual, autonomous workflows keep teams focused on production, not paperwork.
Connected, Whole-Plant Solution
Redzone is the only platform that connects every team in the factory — from frontline teams to senior leaders and across production, quality, and maintenance. As a single source of truth for all teams, Redzone data is relevant and available immediately, driving the right actions at the right time.
Real Results: 5 Days’ Output In 4 Days
When teams are empowered, informed, and connected, OEE improvements and productivity gains are predictable. As our real-world data shows, factories that adopt Redzone achieve five days of production in four days within 90 days of deployment.
Redzone Productivity Was Built For
Frontline Operators
Factory Leaders
Operations Teams
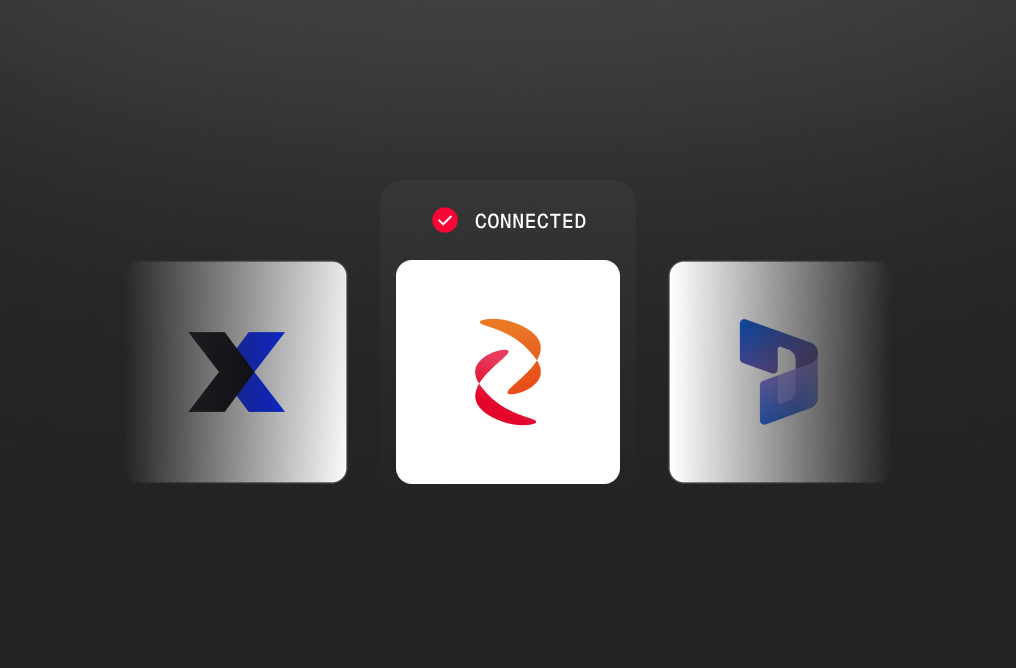
Productivity Seamlessly Connects With the Tools You Already Use
Redzone integrates easily with ERPs and other existing manufacturing systems to seamlessly pull relevant data and establish one centralized source of truth. Use Redzone Integrations to eliminate data silos, import production schedules, see parts inventory levels, update product master data, and reconcile end-of-run reports.
Redzone's integration pathways are system-agnostic, so you can build integration workflows between Redzone and other systems. Redzone partners with industry-leading cloud data and integration platforms, including Boomi and Snowflake, to simplify large, complex integrations.
Increased Productivity
Greater Frontline Engagement
Reduction In Employee Turnover


"From a productivity standpoint, we really saw Redzone aligning with performance. The team knows the score at the end of the day, and they know how they are performing at any given moment throughout the production floor."
James Hinkle
Plant General Manager
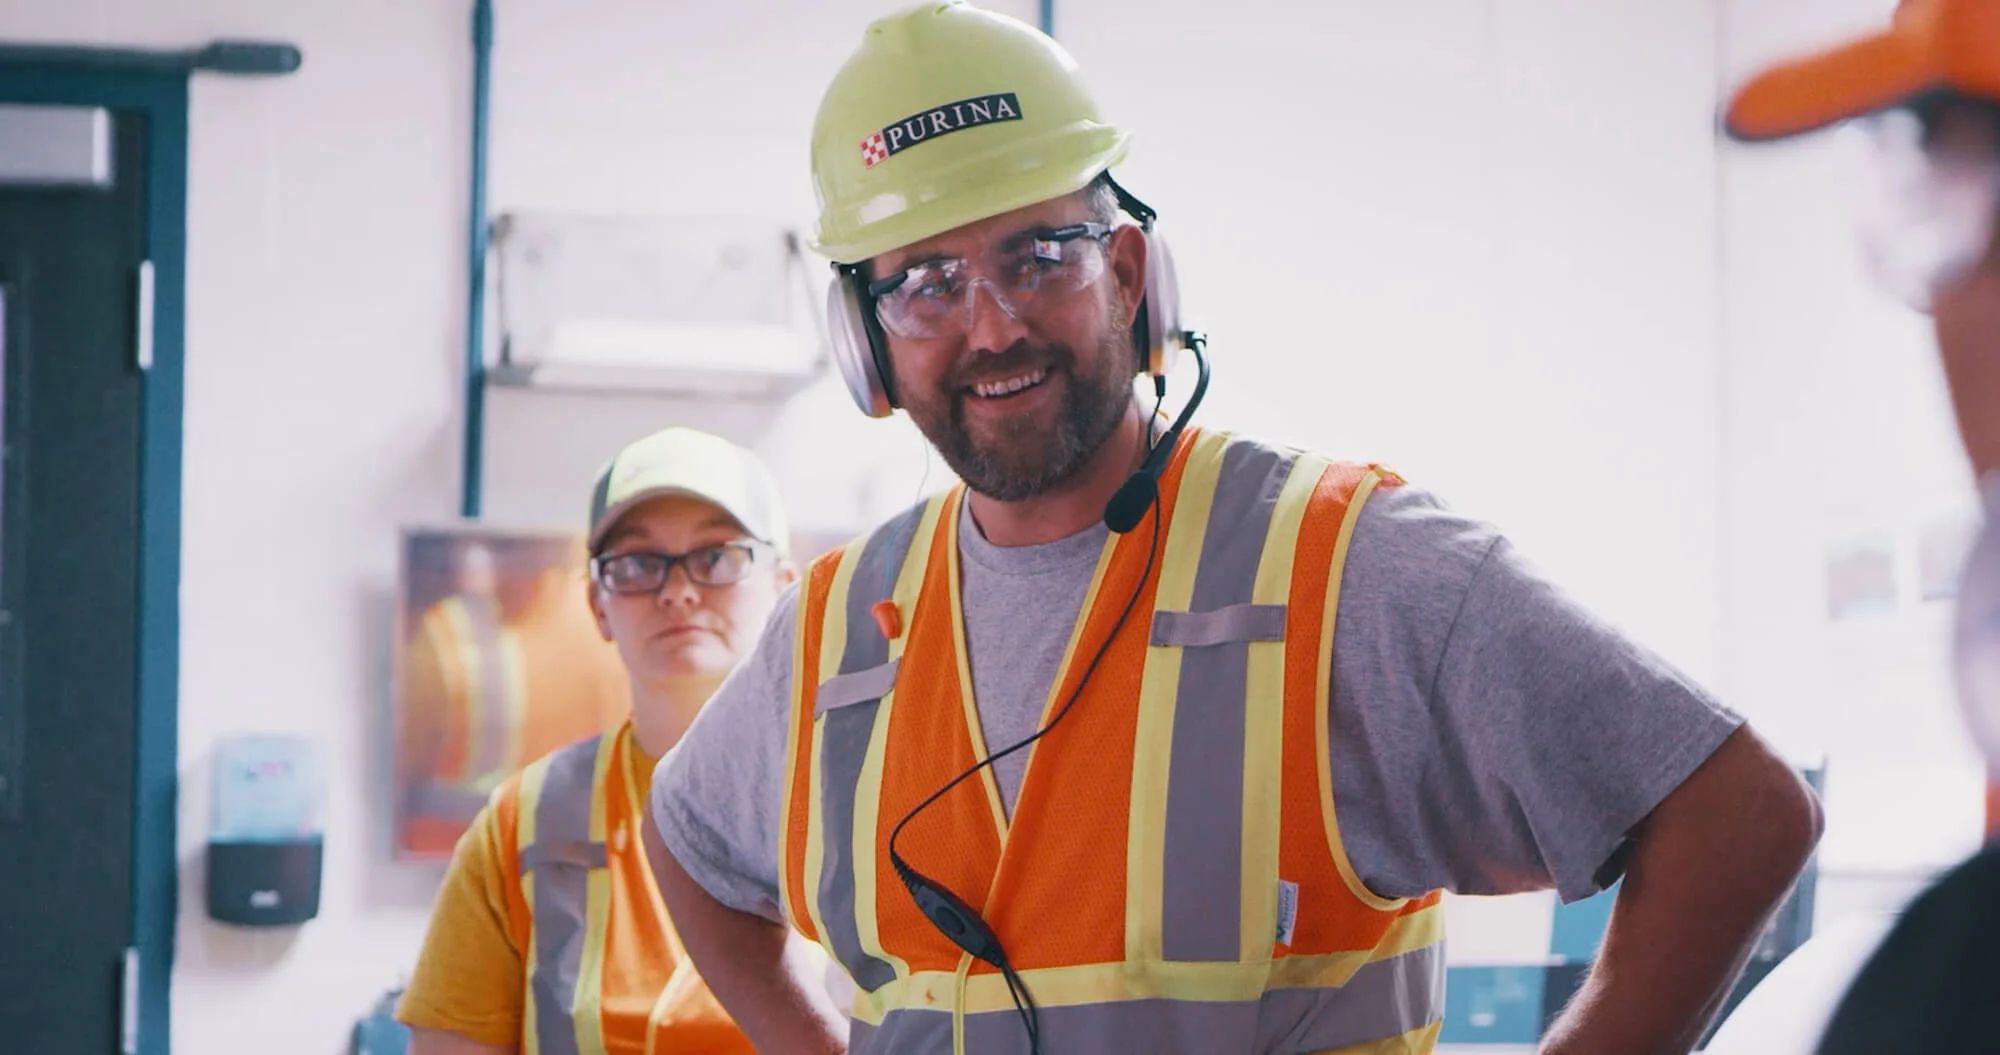
"Every 7th plant we launch Redzone in, we get a free plant’s worth of capacity."
Terry LeDoux
Vice President at Nestle Purina
"Our ROI was way better than even we projected. Of all the systems implementations, it’s absolutely been one of the most successful."
Kevin Shayer
VP Ops & Supply Chain at Allied Wire & Cable
Frequently Asked Questions
Didn’t find what you need? View the full FAQ.
How do I use agentic AI in my production schedule?
Embedding AI in production scheduling goes leaps beyond standard optimization models. When shop-floor events alter schedules, AI agents will autonomously reason, propose, and even execute schedule changes. Successful models use a Human-in-the-Loop approach, prompting operators to approve changes and then communicating the new schedule across teams for alignment.
How is Redzone different from QMS, CMMS, or MES software?
Redzone is a connected workforce platform for the whole factory floor. It includes OEE monitoring and centralized quality and maintenance management in one system. Instead of siloed tools, Redzone connects performance data, shop-floor quality, equipment reliability, issue management, coaching, and collaboration, so teams can act on insights immediately.
How is Redzone different from productivity dashboards or OEE software?
Redzone is different because it focuses on improving productivity through execution, not just measurement. While dashboards show what happened, Redzone helps frontline teams respond in the moment — turning insights into action and sustained productivity gains.
Why is my ERP failing to drive frontline productivity?
Most ERPs are systems of record designed for data collection and management. To drive productivity on the shop floor, you need a system of action. ERPs typically operate on batch processing or manual end-of-shift entries with lagging data. Productivity is driven by people who are working in real time with real parts.
Helpful Resources

Lorem ipsum dolor sit amet, consectetur adipiscing elit. Suspendisse varius enim in eros elementum tristique. Duis cursus, mi quis viverra ornare, eros dolor interdum nulla, ut commodo diam libero vitae erat. Aenean faucibus nibh et justo cursus id rutrum lorem imperdiet. Nunc ut sem vitae risus tristique posuere.
OEE Manufacturing: Maximizing Efficiency and Productivity

Lorem ipsum dolor sit amet, consectetur adipiscing elit. Suspendisse varius enim in eros elementum tristique. Duis cursus, mi quis viverra ornare, eros dolor interdum nulla, ut commodo diam libero vitae erat. Aenean faucibus nibh et justo cursus id rutrum lorem imperdiet. Nunc ut sem vitae risus tristique posuere.