How Manufacturing Teams Use Fishbone Diagrams to Find Root Causes


.webp)
published
July 27, 2026
Key Takeaways
A fishbone diagram (also called an Ishikawa or cause-and-effect diagram) maps potential root causes of a manufacturing problem across six categories: manpower, machine, method, material, measurement, and Mother Nature.
A well-constructed problem statement is specific, measurable, and tied to a shift or SKU.
Frontline operators hold most of the knowledge across the 6Ms and can surface causes that engineers and managers might miss.
The fishbone generates hypotheses; the 5 Whys confirms the root cause. Used together, they move teams from "we have a problem" to "we know what to fix."
Connecting root-cause analysis to real-time shop floor data turns insight into action.
What Is a Fishbone Diagram?
A fishbone diagram (also called an Ishikawa or cause-and-effect diagram) is a structured, visual root-cause analysis (RCA) tool that maps the underlying contributors to a manufacturing defect or quality problem. It was developed in the 1940s by Japanese quality control pioneer Dr. Kaoru Ishikawa as part of Japan’s post-war manufacturing quality movement.
The name "fishbone diagram" comes from its appearance. The layout resembles the skeleton of a fish: a horizontal “spine” that ends in a defined problem statement (the fish head), with multiple diagonal “bones” extending from it, each representing categories of potential root causes.
{{callout1}}
The 6M Framework for Manufacturing
Fishbone root cause analysis' guides teams beyond surface-level symptoms to identify the true drivers of failure on the factory floor. It promotes clarity, collaboration, and accountability.
The 6M model is the most common fishbone framework in manufacturing. It describes six categories that cause many manufacturing problems.
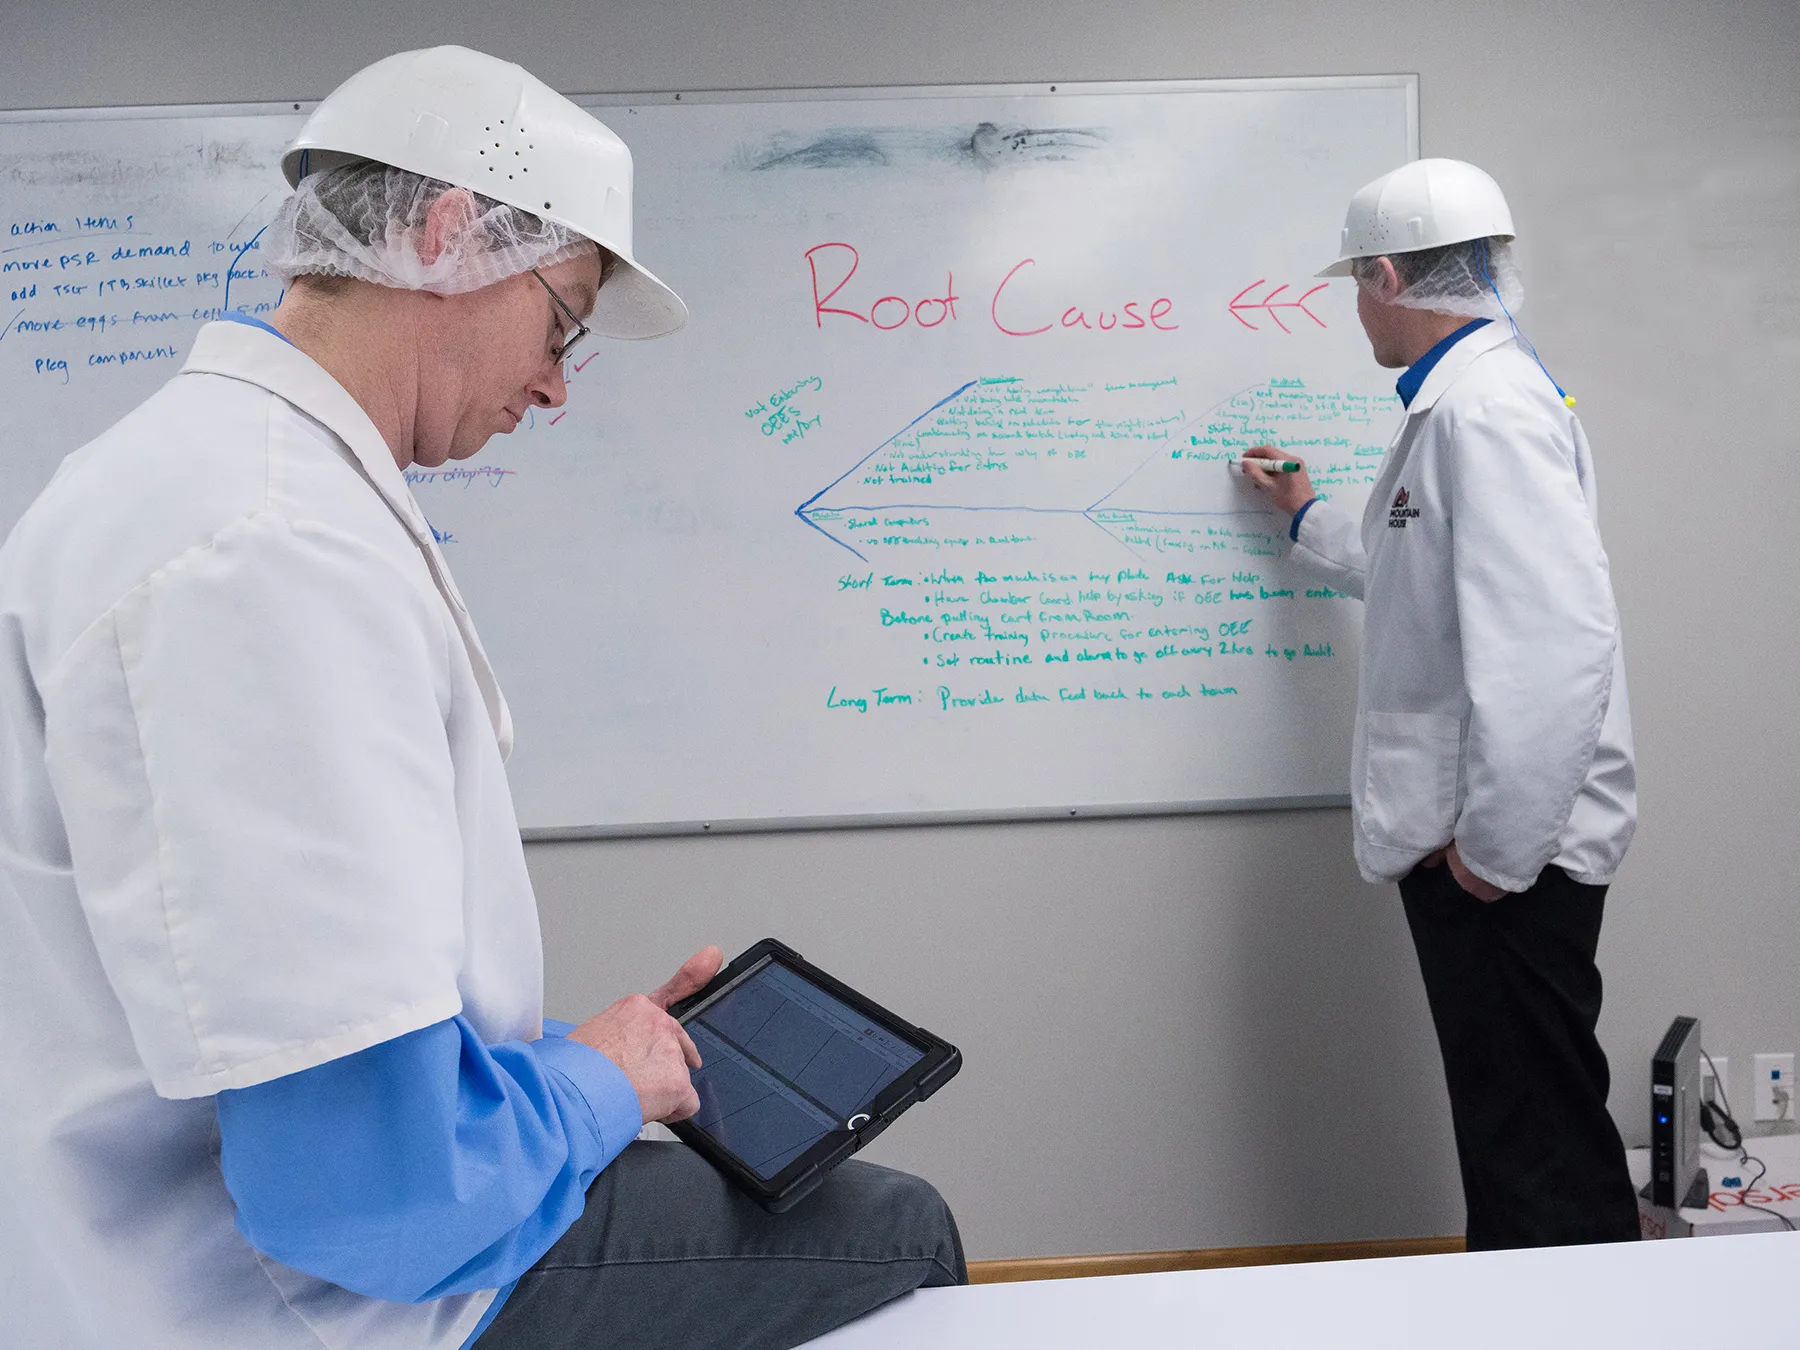
Many fishbone analysis sessions happen in conference rooms, but frontline workers hold most of the knowledge about the 6Ms. Capturing frontline observations with a structured connected workforce platform makes it straightforward to access their insights. This transforms a fishbone RCA exercise from a whiteboard workshop into actionable information based on shop-floor experience.
How To Do a Fishbone Diagram Root Cause Analysis in Manufacturing
A fishbone analysis acts as a hypothesis filter, ensuring teams don’t jump into statistical modeling with blind guesses, but instead work from a focused list of credible, context-rich causes.
1. Define the Problem Statement
A good problem statement is specific, measurable, and tied to an actual performance deviation (e.g., a shift, line, or SKU). Quantifying the problem is essential; without a measurable baseline and deviation, you can't determine whether a solution worked or performance changes are incidental to the solution.
- Poor problem statement: “Production is slow.”
This is too broad and lacks actionable context. It doesn’t specify what part of production, how slow, or relative to what benchmark. - Good problem statement: “Widget X throughput dropped by 35% in Q1 2026 compared to Q4 2025.”
This is grounded in data, defines a measurable deviation, and anchors the issue in a clear timeframe and process.
2. Assemble the Right Team
Include the operations manager, quality assurance, maintenance team, and frontline operators who work on the specific issue. Frontline operators have the hands-on experience to surface potential causes that engineers might miss.
3. Create the Fishbone Outline
While you can sketch the fishbone outline on a large whiteboard, digital fishbone tools or connected worker platforms let teams build and share it across shifts without a shared physical space. Enter the problem statement on the right and create a line extending horizontally to the left (the head and spine). You will add lines for the "bones" in the next step.
4. Brainstorm and Prioritize Causes
Brainstorm potential causes across the 6Ms (machinery, methods, manpower, measurements, materials, and Mother Nature), and decide which "Ms" are involved. Draw lines extending off the spine (the bones) for the relevant 6M categories, and add sub-bones extending from the bones for specific hypotheses.
Gather data on the most probable causes, then vote on the top two or three most likely causes.
5. Validate and Plan a Solution
Decide the best way to solve the problem. Before you implement your solution, confirm the plan's feasibility using production data and experience.
6. Implement the Plan
Assign owners to implement the plan, set milestones and deadlines, choose metrics to measure outcomes, and schedule a follow up to evaluate its effectiveness. Make sure to update your SOPs and training materials to close the loop across shifts and ensure everyone is using the right processes.
{{callout2}}
A Manufacturing Example: The Night Shift Scenario
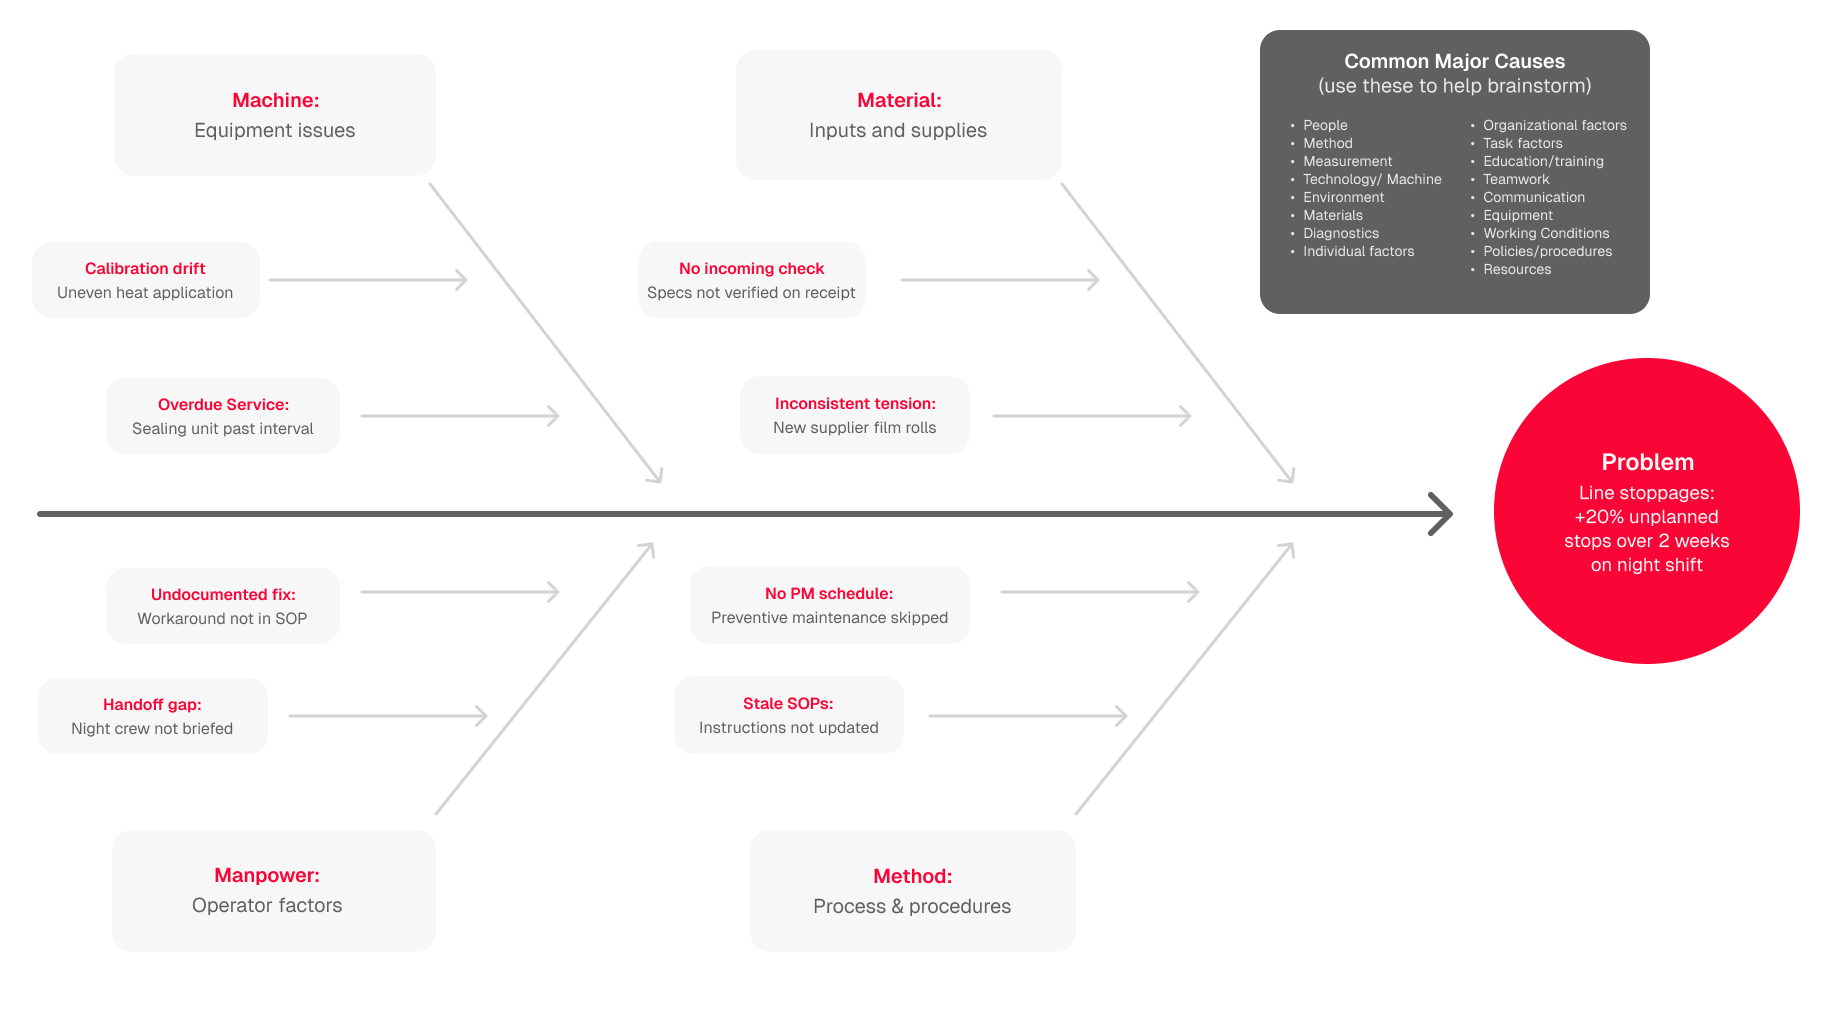
Here's how a food and beverage manufacturer evaluating an unexpected line stoppage problem on the night shift might approach a Fishbone analysis project.
- Define the problem statement: Unplanned line stops have increased 20% over the last two weeks on the night shift.
- Assemble the right team: Schedule a meeting with the operations manager, quality assurance, a maintenance team member, and a shift leader and frontline operator from the day and night shifts.
- Create the fishbone outline: In the "head," write "Line stoppages: +20% unplanned stops over 2 weeks."
- Brainstorm and prioritize causes: Discuss possible root causes and vote on the most probable hypotheses as well as which "M's" are affected. Draw "bones" for each of the "M's" and sub-bones extending from the bones for specific hypotheses. Problems are rarely caused by a single problem, so focus on intersections between the hypotheses to identify the root cause of the line stoppage.
- Validate and plan a solution: Create a plan to solve the line stoppage problems. Before you begin, gather data from frontline software and talk to stakeholders (e.g., maintenance, procurement, shift leaders, and SOP writers) to ensure the plan is feasible.
- Implement the plan: Assign responsible parties to handle each piece of the solution, set implementation deadlines, decide how you'll measure outcomes, and schedule a future meeting to evaluate the plan.
Fishbone + 5 Whys: Better Together
Many teams use the 5 Whys method alongside a fishbone diagram to move from identifying possible cause categories to confirming the actual breakdown within them.
A 5 Whys analysis means asking "Why" questions five times in a row to drill down into an issue until you reach the root cause. Here's how it might work in the scenario above:
- Why are packages failing inspection? → Because the seals are not holding.
- Why are the seals failing? → Because the sealing machine is applying uneven heat.
- Why is the heat uneven? → Because the machine hasn’t been calibrated recently.
- Why hasn’t it been calibrated? → Because the maintenance schedule wasn’t followed.
- Why wasn’t the schedule followed? → Because PM instructions weren't updated, so the night shift isn't following it.
In this scenario, the root cause of line stoppages is an undocumented maintenance schedule that the day shift follows but was never shared with the night shift.
But knowing the root cause isn't enough if the fix doesn't reach the people who need it.
From Whiteboard to Shop Floor Action
Traditional fishbone diagrams are powerful, but static. They capture human insight at a specific point in time but lack real-time data inputs and system-level feedback. This limitation is critical in high-velocity manufacturing environments, where delays in identifying root causes can compound losses.
This is where connected worker solutions (CWS) and digital dashboards make a difference. These technologies don’t replace the fishbone. They supercharge it.
Modern manufacturing doesn’t wait for end-of-shift reports or post-mortem reviews. CWS platforms integrate seamlessly with frontline workflows, enabling teams to capture issues as they happen and trace them back to system-generated data.
- Teams catch problems in real time, on the shop floor, before they escalate.
- Internet of Things (IoT)-enabled machines automatically log quality deviations (e.g., fill weights, vibration levels, or temperatures) to alert operators or maintenance.
- Triggers launch predefined root cause workflows the moment a parameter deviates from spec, decreasing quality errors and rework.
- Every alert, adjustment, or anomaly is logged in real time and creates a verifiable audit trail for RCA and compliance documentation.
- AI surfaces patterns across shifts to uncover root causes of complex issues that would otherwise be impossible to solve.
Connected worker platforms capture observations, measurements, and process deviations directly from the shop floor. Combined with automated alerts, sensor data, and integrated workflows, these platforms feed actionable inputs into root cause analysis without waiting for a post-mortem.
The Bottom Line
For manufacturing leaders, a fishbone's value isn't in the diagram — it's in what the team does next. When root cause analysis is connected to real-time shop-floor data, corrective actions get assigned, tracked, and closed instead of forgotten. Learn how Redzone's AI-powered CWS helps manufacturing teams capture quality events in real time, so your next fishbone session starts with data — not guesswork. Book a demo to see how it works.

Frequently Asked Questions
What is the difference between a fishbone diagram and 5 Whys?
Use a fishbone diagram to brainstorm and visualize potential root causes of an issue. Use 5 Whys to drill into potential reasons to reveal the true root cause. Used together, they move manufacturers from "we have a problem" to "we know what to fix."
How is fishbone analysis used in manufacturing?
Manufacturers use fishbone diagrams to identify root causes of defects, particularly where machines, materials, and human inputs interact. They bring structure to high-stakes, complex work environments and connect frontline workers to solutions that stick.
When should manufacturers use a fishbone diagram?
Use a fishbone diagram when you know a specific problem but don't know its root cause. It structures brainstorming to help uncover cause-and-effect relationships between factors.
What are the 6 Ms in a fishbone diagram?
The 6Ms are machinery, methods, manpower, measurements, materials, and Mother Nature. These categories cause many manufacturing problems, so they are the "bones" of a fishbone diagram.
How do you prioritize causes in a fishbone analysis?
Prioritize causes in a fishbone analysis by correlating relevant data, insights from responsible parties, and 5 Whys results, then vote on causes.